DOE
- Aiden Lim
- Jan 28, 2025
- 5 min read

Introduction:
The Design of Experiments (DOE) is a systematic strategy for planning, carrying out, analyzing, and interpreting controlled experiments to determine the elements that influence a process or product. It is commonly used in industries including as manufacturing, healthcare, and software development to optimize processes, enhance quality, and cut costs. In this blog, we'll look at the fundamentals of DOE, its benefits, and how to visualize experimental data with Excel.
What is Design of Experiments (DOE)?
DOE is a statistical approach that helps researchers and engineers identify the relationship between input variables and output variables. By systematically varying the factors, DOE allows you to determine which factors have the most significant impact on the outcome.
Key Concepts in DOE:
Factors: Input variables that can be controlled.
Levels: Specific values assigned to factors.
Response: The output or result of the experiment.
Replication: Repeating the experiment to ensure reliability.
Randomization: Randomly assigning experimental runs to reduce bias.
Let move into the main topic of today which is the case study i am about to share.

What each alphabet stand for each factor Full Factorial:

Data Table Used for Single and interaction 
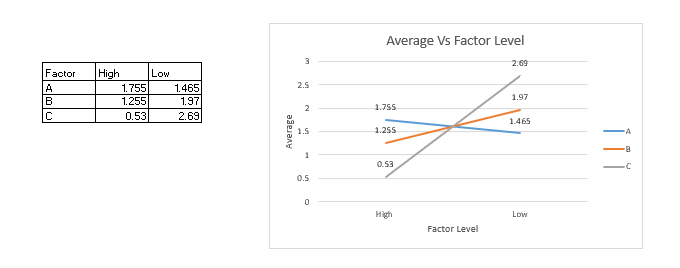
Single Effect Interpretation of Single Effect:
Factor A :
The line is almost flat, indicating that changing the bowl diameter from 10 cm (low) to 15 cm (high) has a small effect on the number of bullets.
The average bullets decrease slightly from 1.56 g (low) to 1.41 g (high).
Factor B :
The line has a steeper slope, indicating that increasing the microwaving time from 4 minutes (low) to 6 minutes (high) significantly reduces the number of bullets.
The average bullets decrease from 2.00 g (low) to 0.97 g (high).
Factor C :
The line has the steepest slope, indicating that increasing the power from 75% (low) to 100% (high) has the largest effect on reducing bullets.
The average bullets decrease from 2.42 g (low) to 0.55 g (high).
Ranking of Factors:
Factor C : Largest effect
Factor B : Moderate effect
Factor A : Smallest effect

Interpretation (A X B):
The gap between the two lines suggests a mild interaction effect.
The impact of time (B) on bullets is more pronounced when using a large bowl (A+).
Interpretation (A X C):
The two lines are nearly parallel, suggesting a weak interaction between A and C.
Power (C) has a dominant effect on bullets, regardless of the bowl diameter
Interpretation (B X C):
The two lines are not parallel, meaning there is a strong interaction effect.
Power (C) has a much stronger effect when microwaving time is short (B-), but a slightly weaker effect when microwaving time is longer (B+).
This is the most significant interaction effect in the experiment.
Final Conclusion for full factor
To minimize bullets, higher microwaving power (C+) and longer microwaving time (B+) should be used. The bowl size (A) has a minor effect, but choosing the right power and time settings is far more important.
Fractional factor:

interpretation:
Factor A (Diameter):
The line is almost flat, indicating a small effect on the number of bullets.
The average bullets decrease slightly from 1.56 g (low) to 1.41 g (high).
Factor B (Microwaving Time):
The line has a steeper slope, indicating that increasing the microwaving time significantly reduces the number of bullets.
The average bullets decrease from 2.00 g (low) to 0.97 g (high).
Factor C (Power):
The line has the steepest slope, indicating that increasing the power has the largest effect on reducing bullets.
The average bullets decrease from 2.42 g (low) to 0.55 g (high).
Ranking of Factors:
Factor C : Largest effect.
Factor B: Moderate effect ).
Factor A : Smallest effect .

Interaction B x A:
Plot: Shows the effect of factor B (at levels B+ and B-) on the response variable, separately for each level of factor A (A+ and A-).
Interpretation: The lines in the plot are not parallel, indicating a significant interaction between factors B and A. When A is at the "+" level, increasing B from B- to B+ leads to a larger increase in the response than when A is at the "-" level. This suggests that the effect of factor B depends on the level of factor A.
Interaction B x C:
Plot: Shows the effect of factor B (at levels B+ and B-) on the response variable, separately for each level of factor C (C+ and C-).
Interpretation: Similar to the B x A interaction, the non-parallel lines suggest a significant interaction between factors B and C. The effect of factor B on the response variable differs depending on the level of factor C.
Interaction A x C :
Plot: Shows the effect of factor C (at levels C+ and C-) on the response variable, separately for each level of factor A (A+ and A-).
Interpretation: Again, the non-parallel lines indicate a significant interaction between factors A and C. The effect of factor C depends on the level of factor A.
Overall Conclusion:
The interaction plots strongly suggest significant two-way interactions between all pairs of factors . This means that the effect of one factor on the response variable is not consistent across different levels of the other factors. A complete analysis would require statistical tests to confirm the significance of these interactions and determine the nature of the interactions more precisely. However, based solely on the visual inspection of the interaction plots, we can conclude that the interactions are significant and should be considered when interpreting the results of the experiment.
Conclusion for Frictional:
The average difference in the response variable between the high and low levels of each factor. The negative signs for Factors B and C indicate that the response variable tends to be lower at the high levels of these factors compared to the low levels.
The average difference in the response variable due to the combined effects of two factors. The negative sign for AB indicates that the interaction effect is negative; the positive signs for AC and BC indicate positive interaction effects
The interaction plots visually confirm the presence of significant interactions. Non-parallel lines in the plots indicate that the effect of one factor depends on the level of another factor. This reinforces the quantitative results from the interaction effect calculations.
Learning point:
The Design of Experiment (DOE) teaches critical skills in understanding and optimizing processes by examining the effects of multiple factors simultaneously. It emphasizes the systematic study of how variables interact, enabling the identification of key factors and their influence on outcomes. DOE fosters efficient experimentation, allowing researchers to minimize time and resource usage while gaining valuable insights into variability and its impact on process reliability. Through statistical tools like ANOVA and regression analysis, it promotes data-driven decision-making and enhances the accuracy of findings. Beyond technical knowledge, DOE cultivates problem-solving, critical thinking, and adaptability, which are essential for tackling complex challenges in engineering, manufacturing, and research. By focusing on practical applications, it equips learners with the ability to innovate, improve quality, and optimize conditions across diverse fields, making it an indispensable tool in both academic and professional settings.


Comments